The Technique of Lapping
Surface Finish Quality
With a given grit size and fluid viscosity, varying the lapping pressure produces a higher or lower material removal rate, a thicker or thinner film, and a rougher or finer surface finish. In practice, therefore, the pressure is usually light at the beginning of the process, increasing as work proceeds, and diminished towards the end. This results in the optimum material removal rate, surface finish, and flatness achieving overall surface finish quality to perfection. The waviness (also known as peaks and valleys) is a calculation of surface irregularities with a spacing greater than the surface roughness. These usually occur due to warping, vibrations, or deflection during the machining process.
Grit size and Surface Finish
As an example, on a steel part hardened to 60 HRc, lapped using silicon carbide 500 grit, a pressure of 250 g/cm squared will produce a surface finish of about Ra= 0.2 my (N4) or Rz 0.6-0.8, whereas by reducing the pressure to 50 g/cm squared, a surface finish of about Ra= 0.05 my (N2) or Rz 0.2-0.3 can be obtained. The correlation between the grit size and surface finish goes hand in hand with each other.
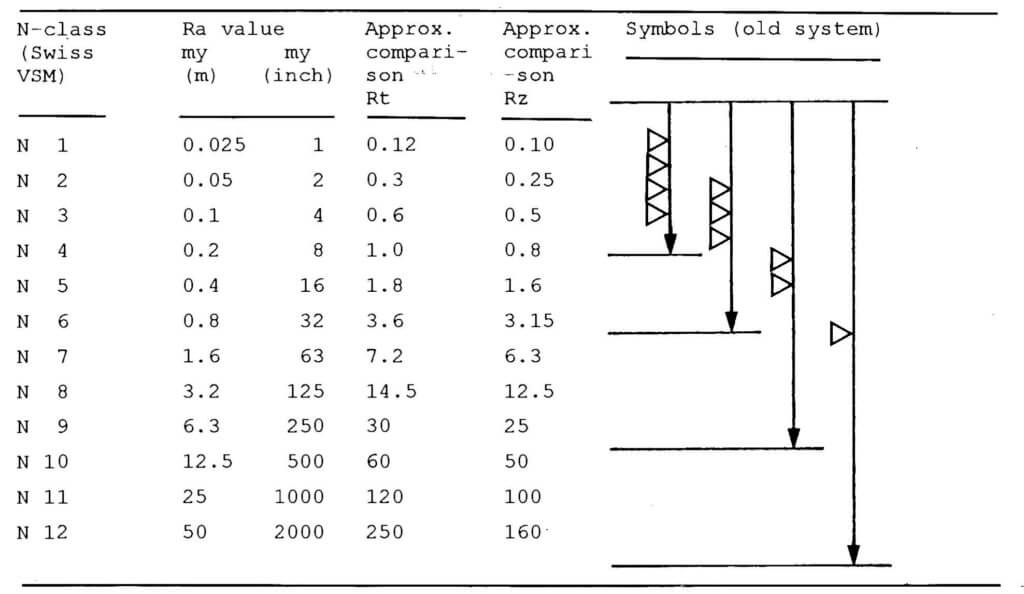
To emphasize, the surface roughness is defined by the minute variations in height of the surface of a given material or workpiece. The individual variances of the peaks and valleys average (Ra value), or quantified by the largest difference from peak-to-valley (Rz). Roughness is usually expressed in microns. A surface that exhibits a Ra of 8 consists of the highest peak and valleys that average no more than 8 µm over a given distance. Roughness may be also measured by comparing the surface of the workpiece to a known sample.
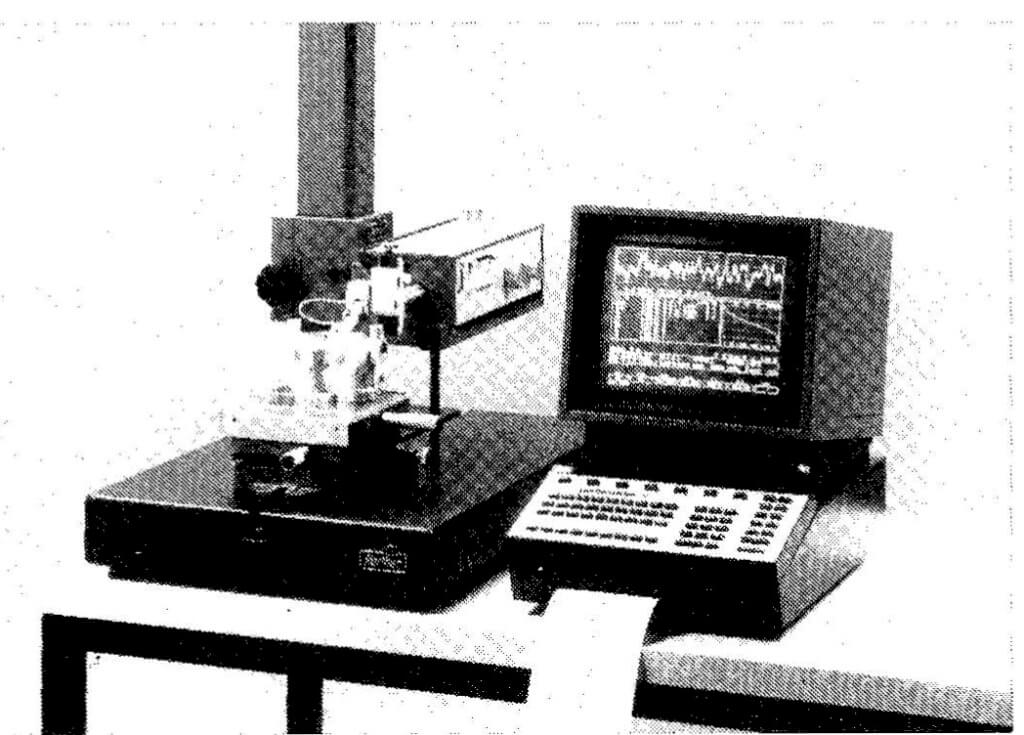
The international surface finish standards (DIN 4762, 4768, ISO 4287/1-2. 4288) are applied in an analogous manner, in that the surface finish quality is specified in Ra values or in the even more accurate Rt values. In practice, the more realistic value Rz is also specified, which is determined by averaging 5 separately measured Rt values. Suitable measuring equipment for acquiring these values are now commercially available (Figure 54).
Flat Surfaces & Readings
Ra is the integer mean of all absolute roughness profile deviations from the centerline within the measurement length. Rz is the absolute peak to valley average of five sequential sampling lengths within the measuring length. Ra compares all dimensions and has no distinguishing value when it comes to separating rejects from suitable cylinders.
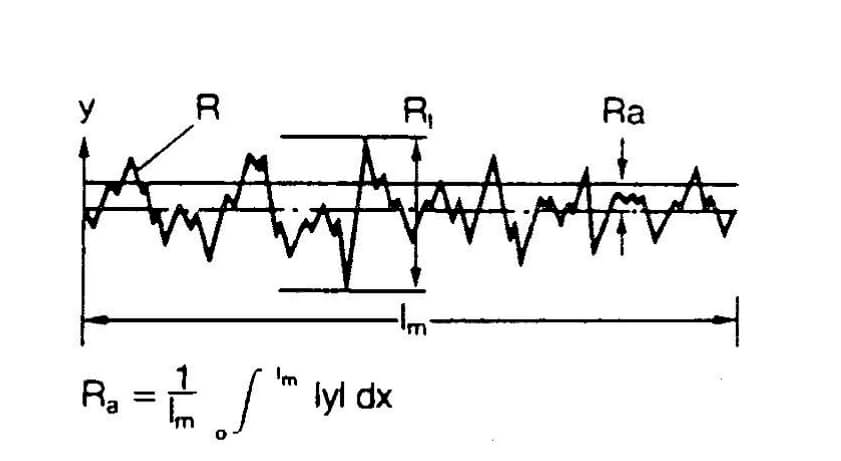
Mean roughness value Ra (DIN 4768) is the arithmetic mean from all values of the roughness profile R within the measuring distance lm. It, therefore, specifies the average deviation of this surface profile from the mean line.
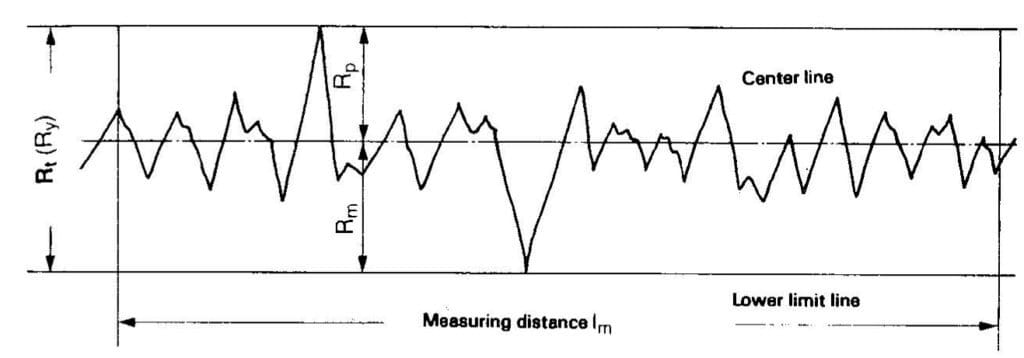
Maximum peak to valley height Rt (DIN 4748) is the vertical distance between the highest peak and lowest peak of the roughness profile R within the overall measuring distance lm. In other words, this is the height difference between the highest mountain and lowest valley within the measured range.
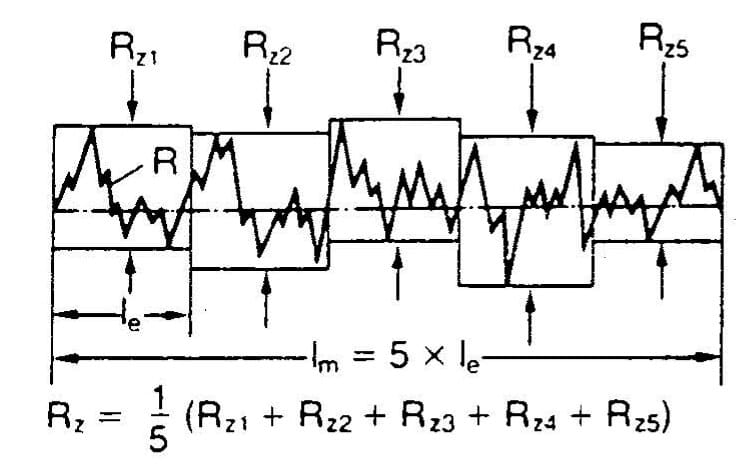
Mean roughness depth Rz (DIN 4768) is the average value from the individual roughness depths of five individuals measuring distances in sequence. In other words, the calculation is from five Rt values. The deviation from the mean line, specifically focusing on the highest peak and valley.
Surface roughness designation systems
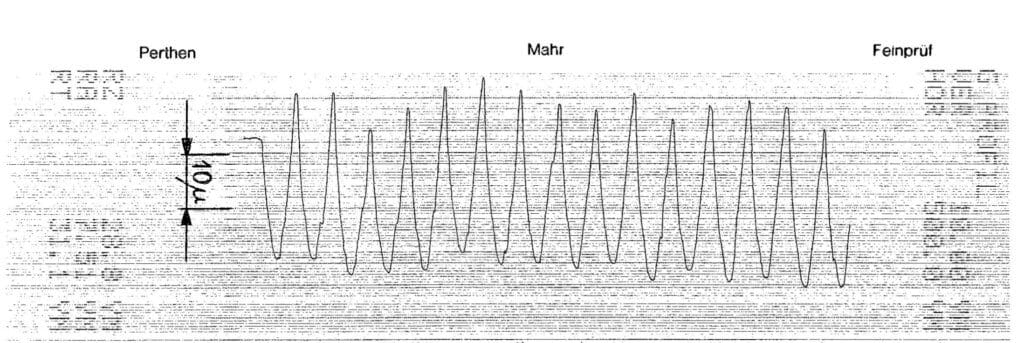
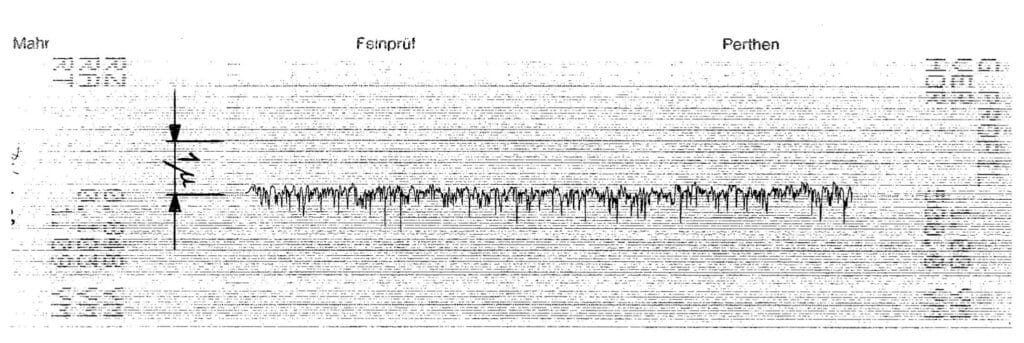
but the vertical scale increased 10 x. Ra 0.103, Rt 1.09.
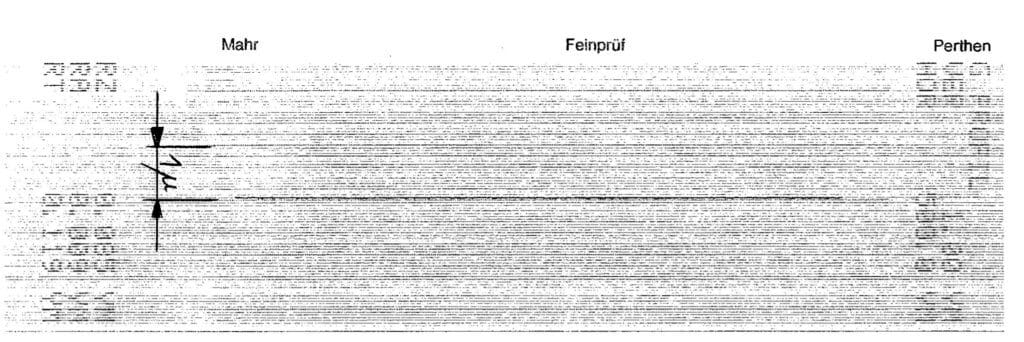
Figure 52: Ra 0.009, Rt 0.119
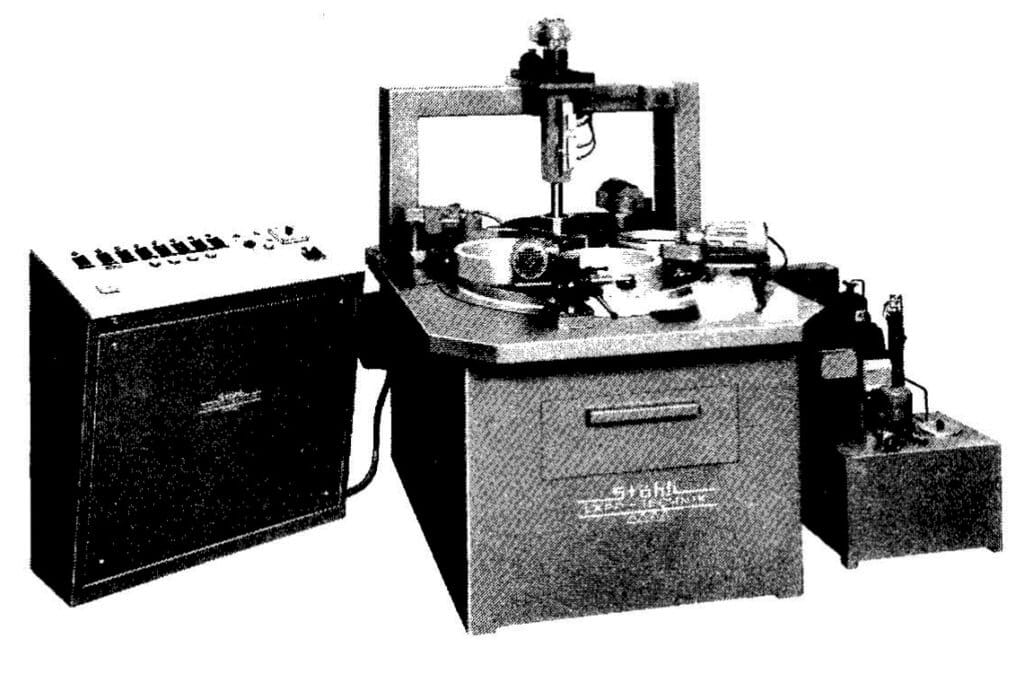
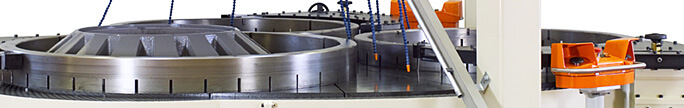
FLM 750-P with cooling unit
Measuring Equipment
Surface roughness and surface flatness are two quite different concepts and are important to remember. Many of the electronic measuring instruments in use today for determining surface finish quality has microprocessor control systems and printers (Figure 54). However, the true value of the results obtained is open to dispute; as most are only approximate, and vary according to the device concerned. To emphasize, it is essential to compare the type of probe (radius), needle pressure, measuring distance, and filtering (cut-off), see DIN Standard 4768.
It is also very important to consider the material of the workpiece, its microstructure, hardness, and type of machining, as well as the direction of the measuring distance with respect to the machining traces. Even when applied with a pressure of only 1 mN, a diamond probe with a radius of 5 microns will compress the surface of a non-ferrous part to about 50% of the roughness depth.
The porosity of the microstructure must be taken into account in the case of
oxide ceramic and sintered metals. Frequently so, bearing ratios are measured at different levels of the surface roughness and specified in %. Visual inspection performing by means of a comparison between a polished surface and an unpolished surface. Seeing the surface texture between the two in the below images.


Figure 57: Shows a matte-lapped aluminum part at a magnification of 1600 and with the corresponding measurement diagram.

